How it works
Each run has one of the following statuses:Skipped steps
When a contact unsubscribes, any remaining Send Email steps in the Automation will be skipped automatically. Other step types (such as Delay, Condition, or Update Contact) will still be executed as normal.Listing runs
- Using the dashboard
- Using the API
Navigate to the Automations page and select an Automation to view its runs.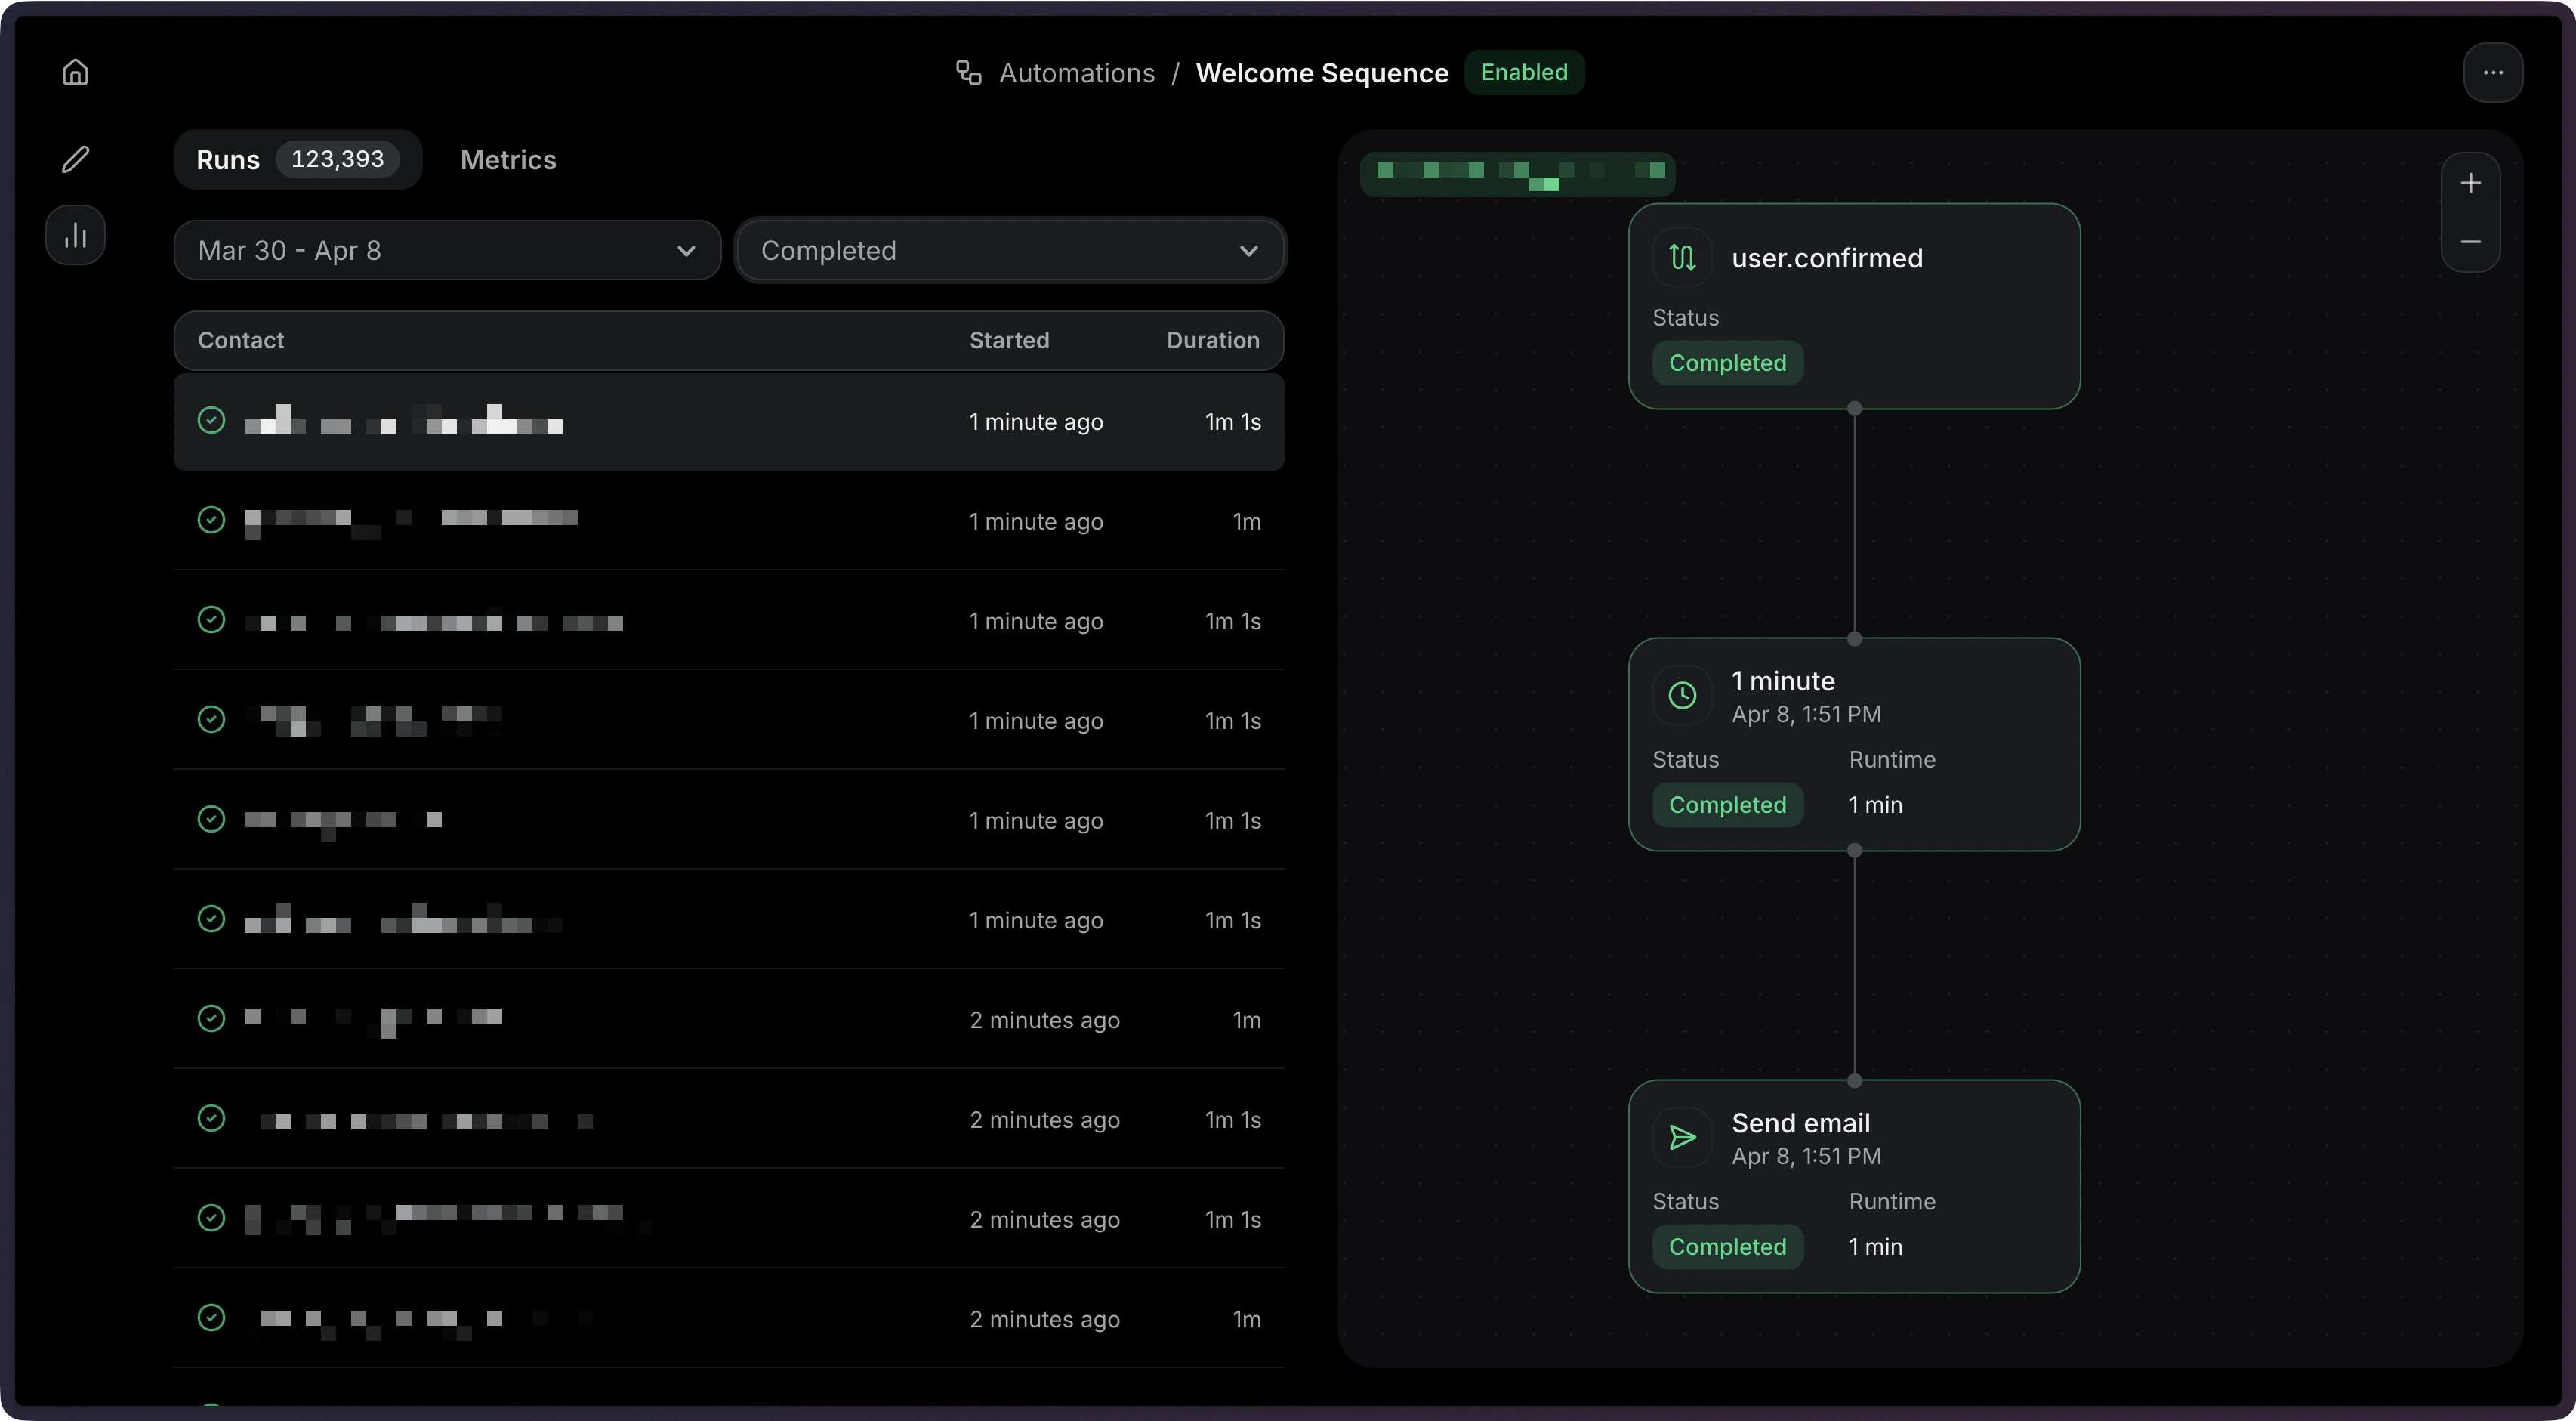
- Status — Whether the run is
running,completed,failed,cancelled, orskipped. - Started — When the run began.
- Duration — When the run finished (if applicable).
Filtering runs by status
- Using the dashboard
- Using the API
You can filter runs by status to find specific executions.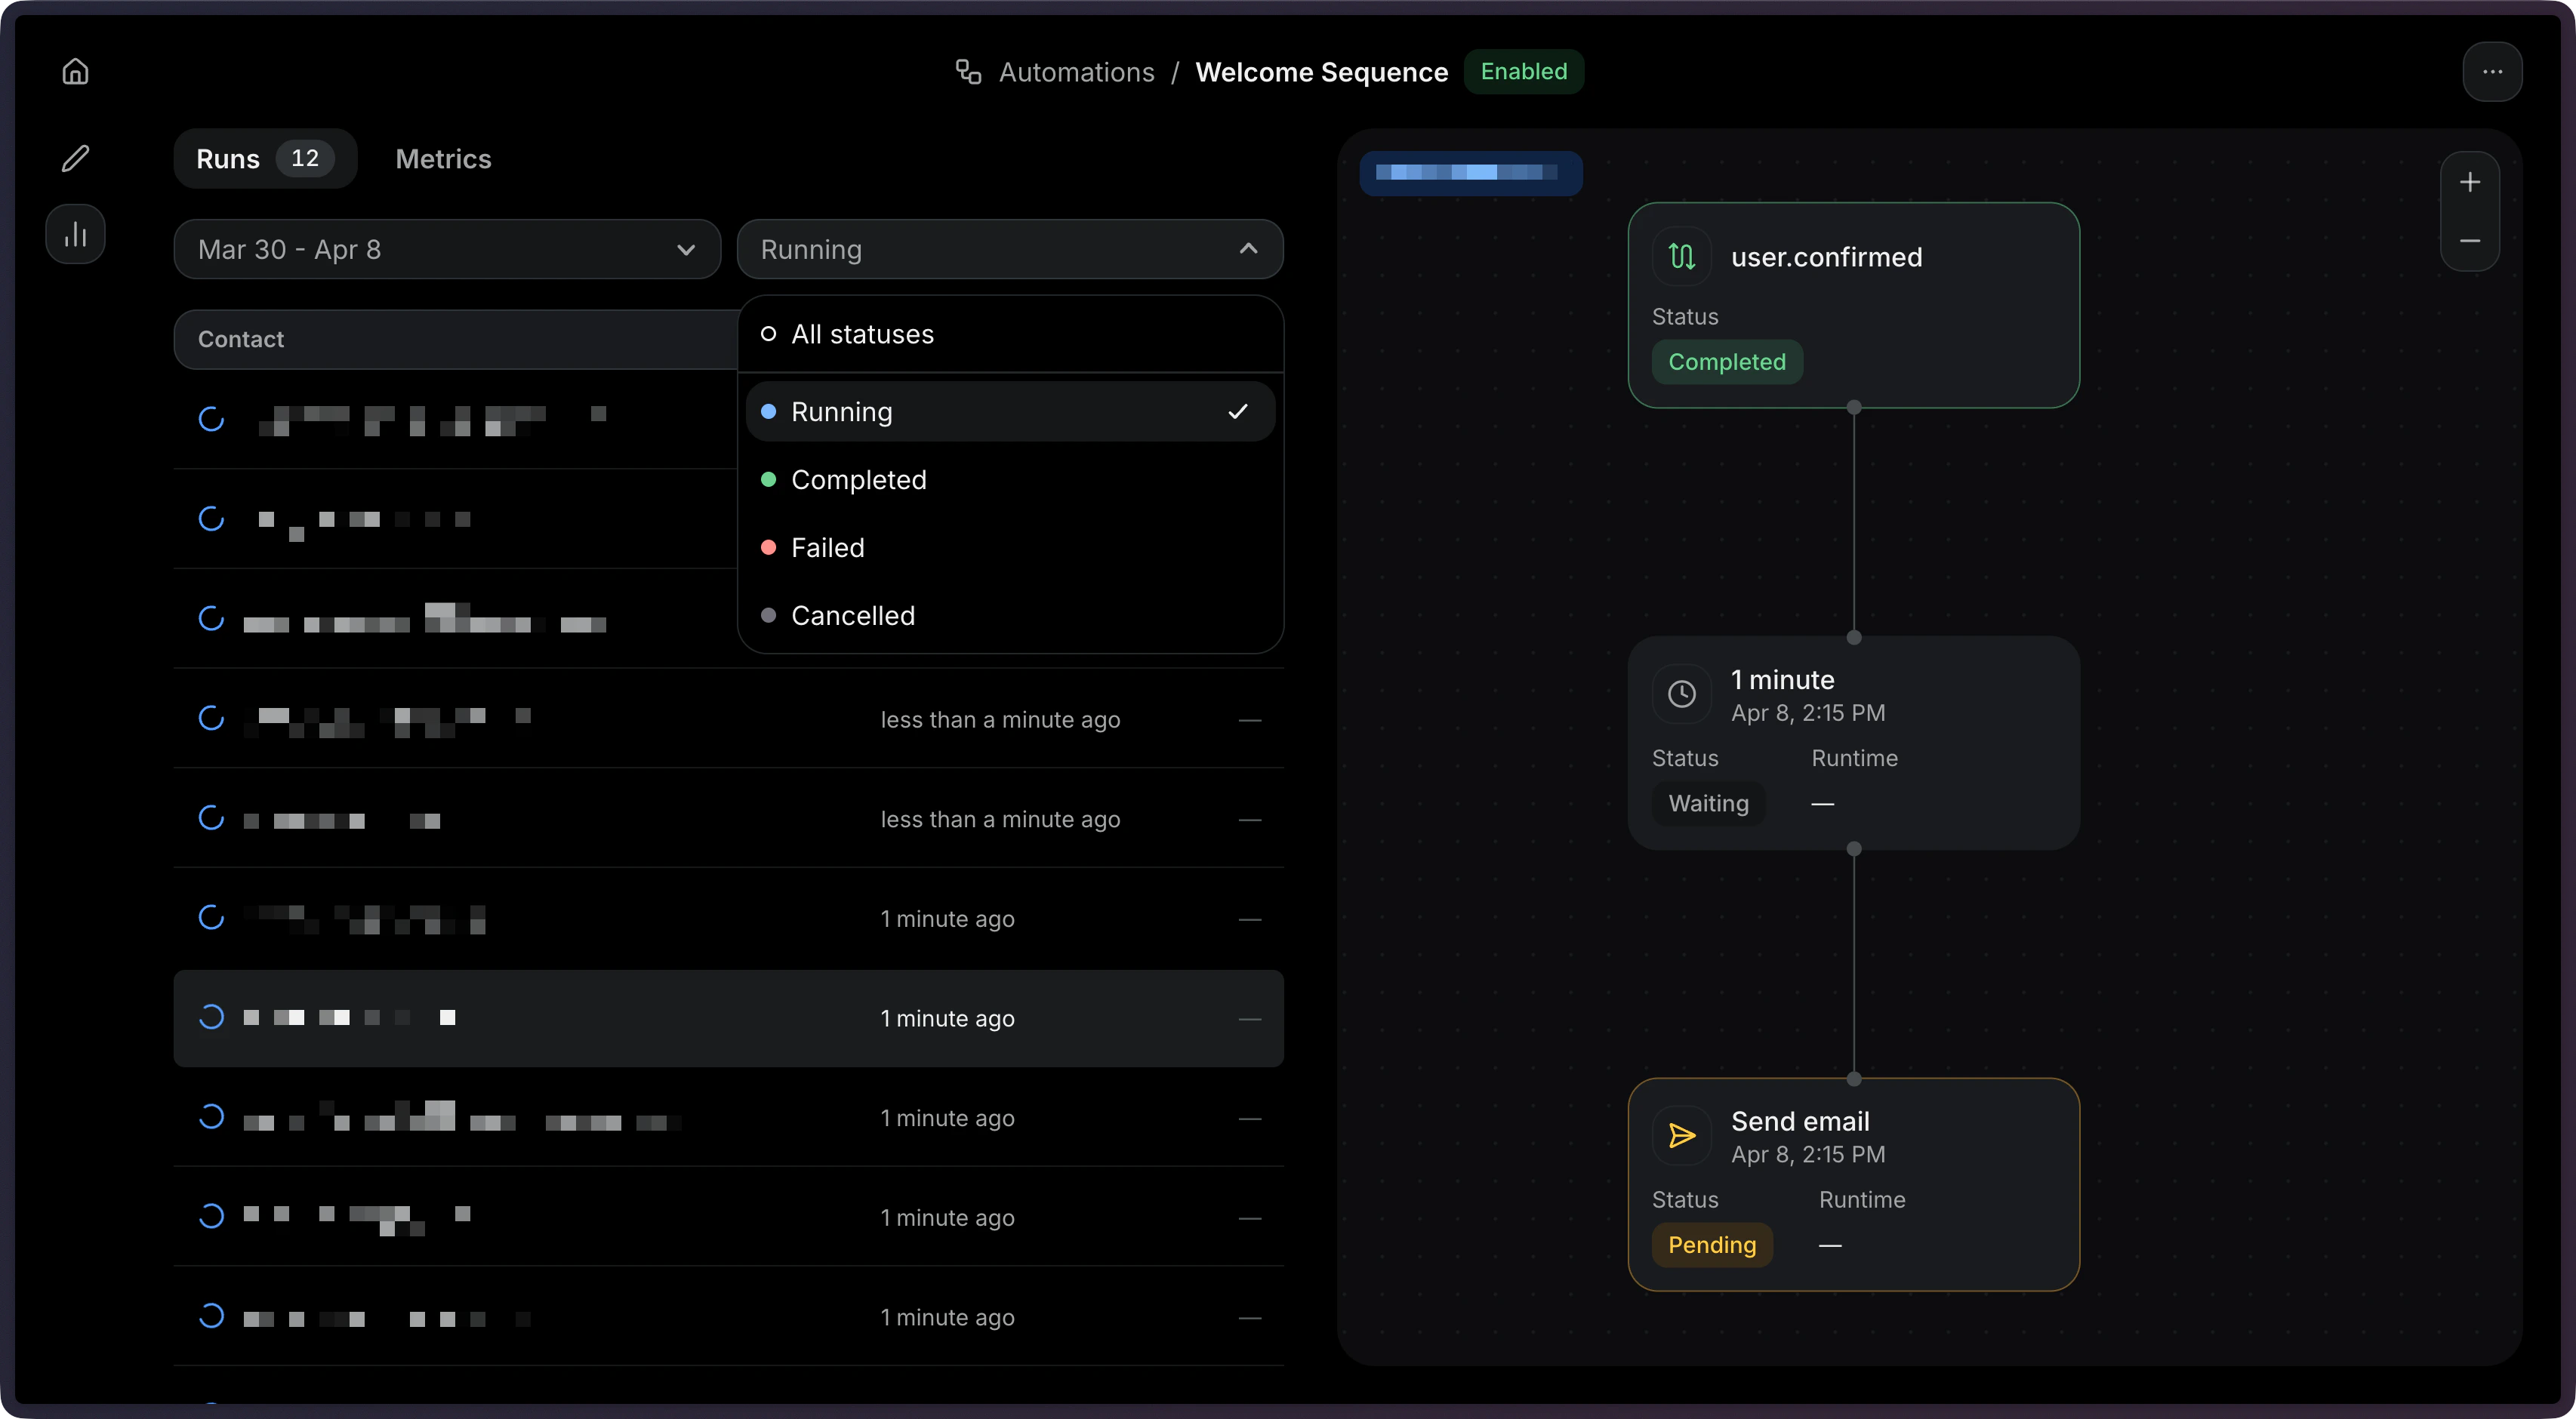
Viewing a single run
- Using the dashboard
- Using the API
Click on a run to view its details, and select the step you want to debug.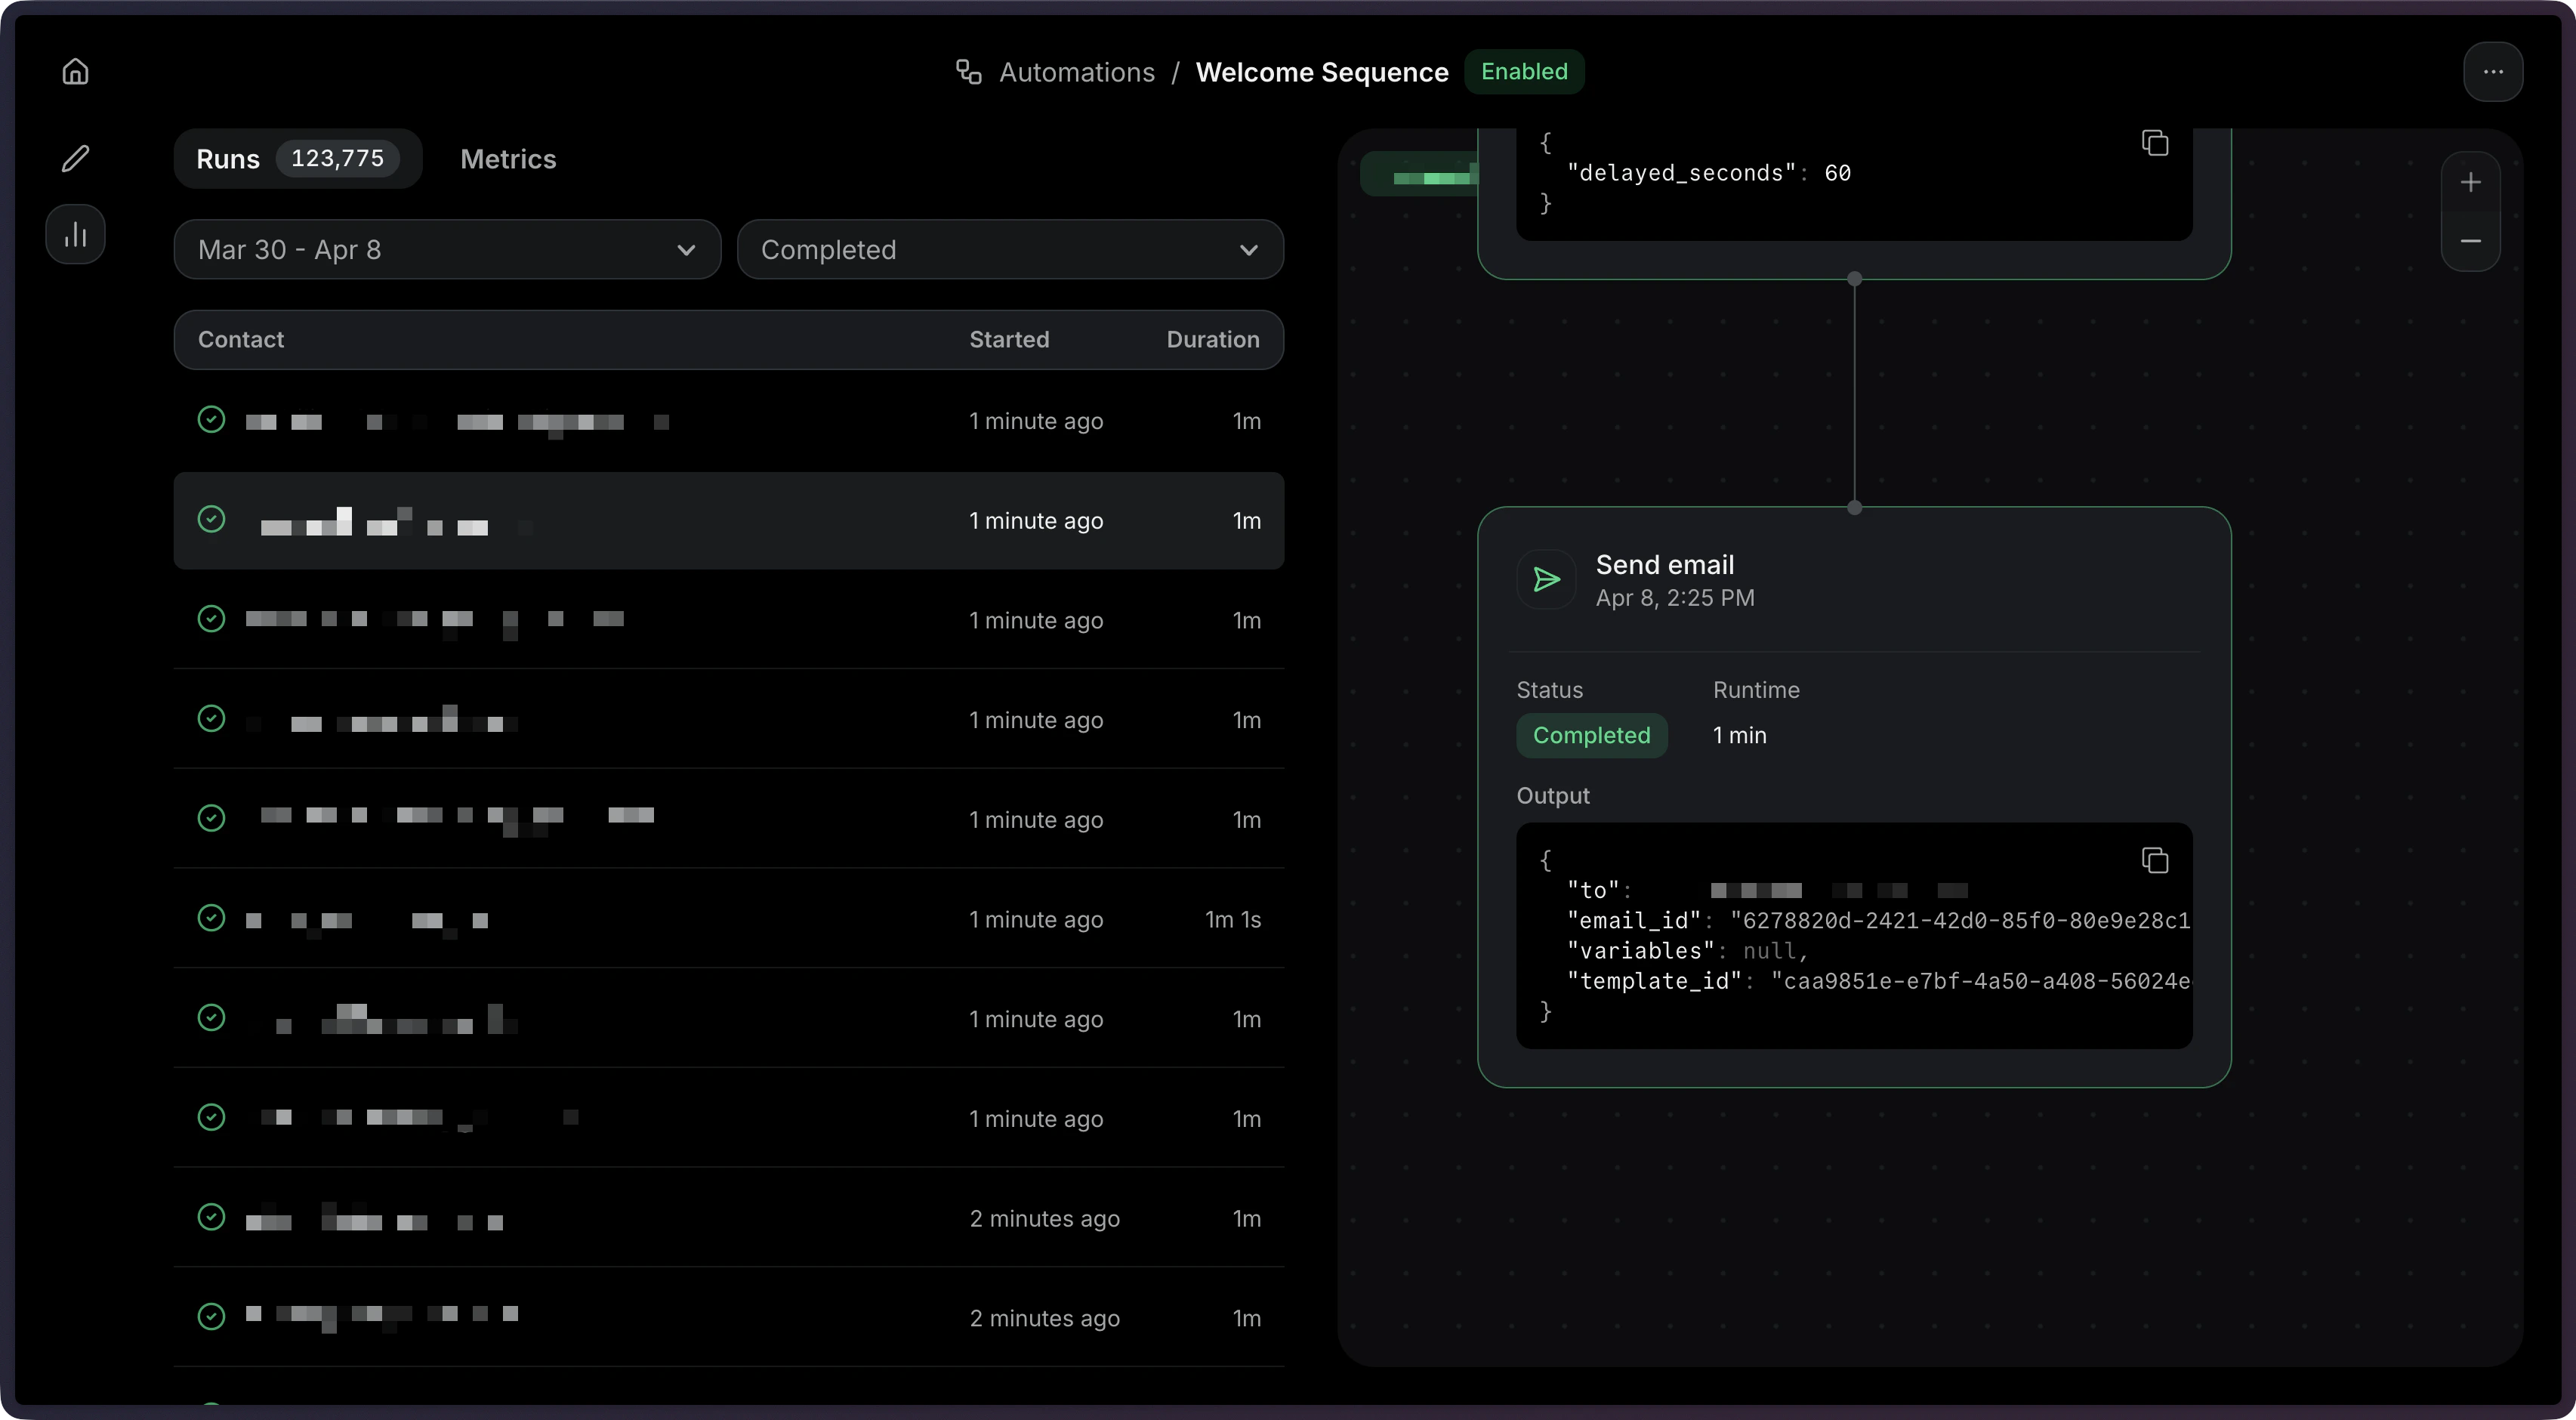
Debugging failed runs
- Using the dashboard
- Using the API
Go to the Runs tab and click on a run to view the details.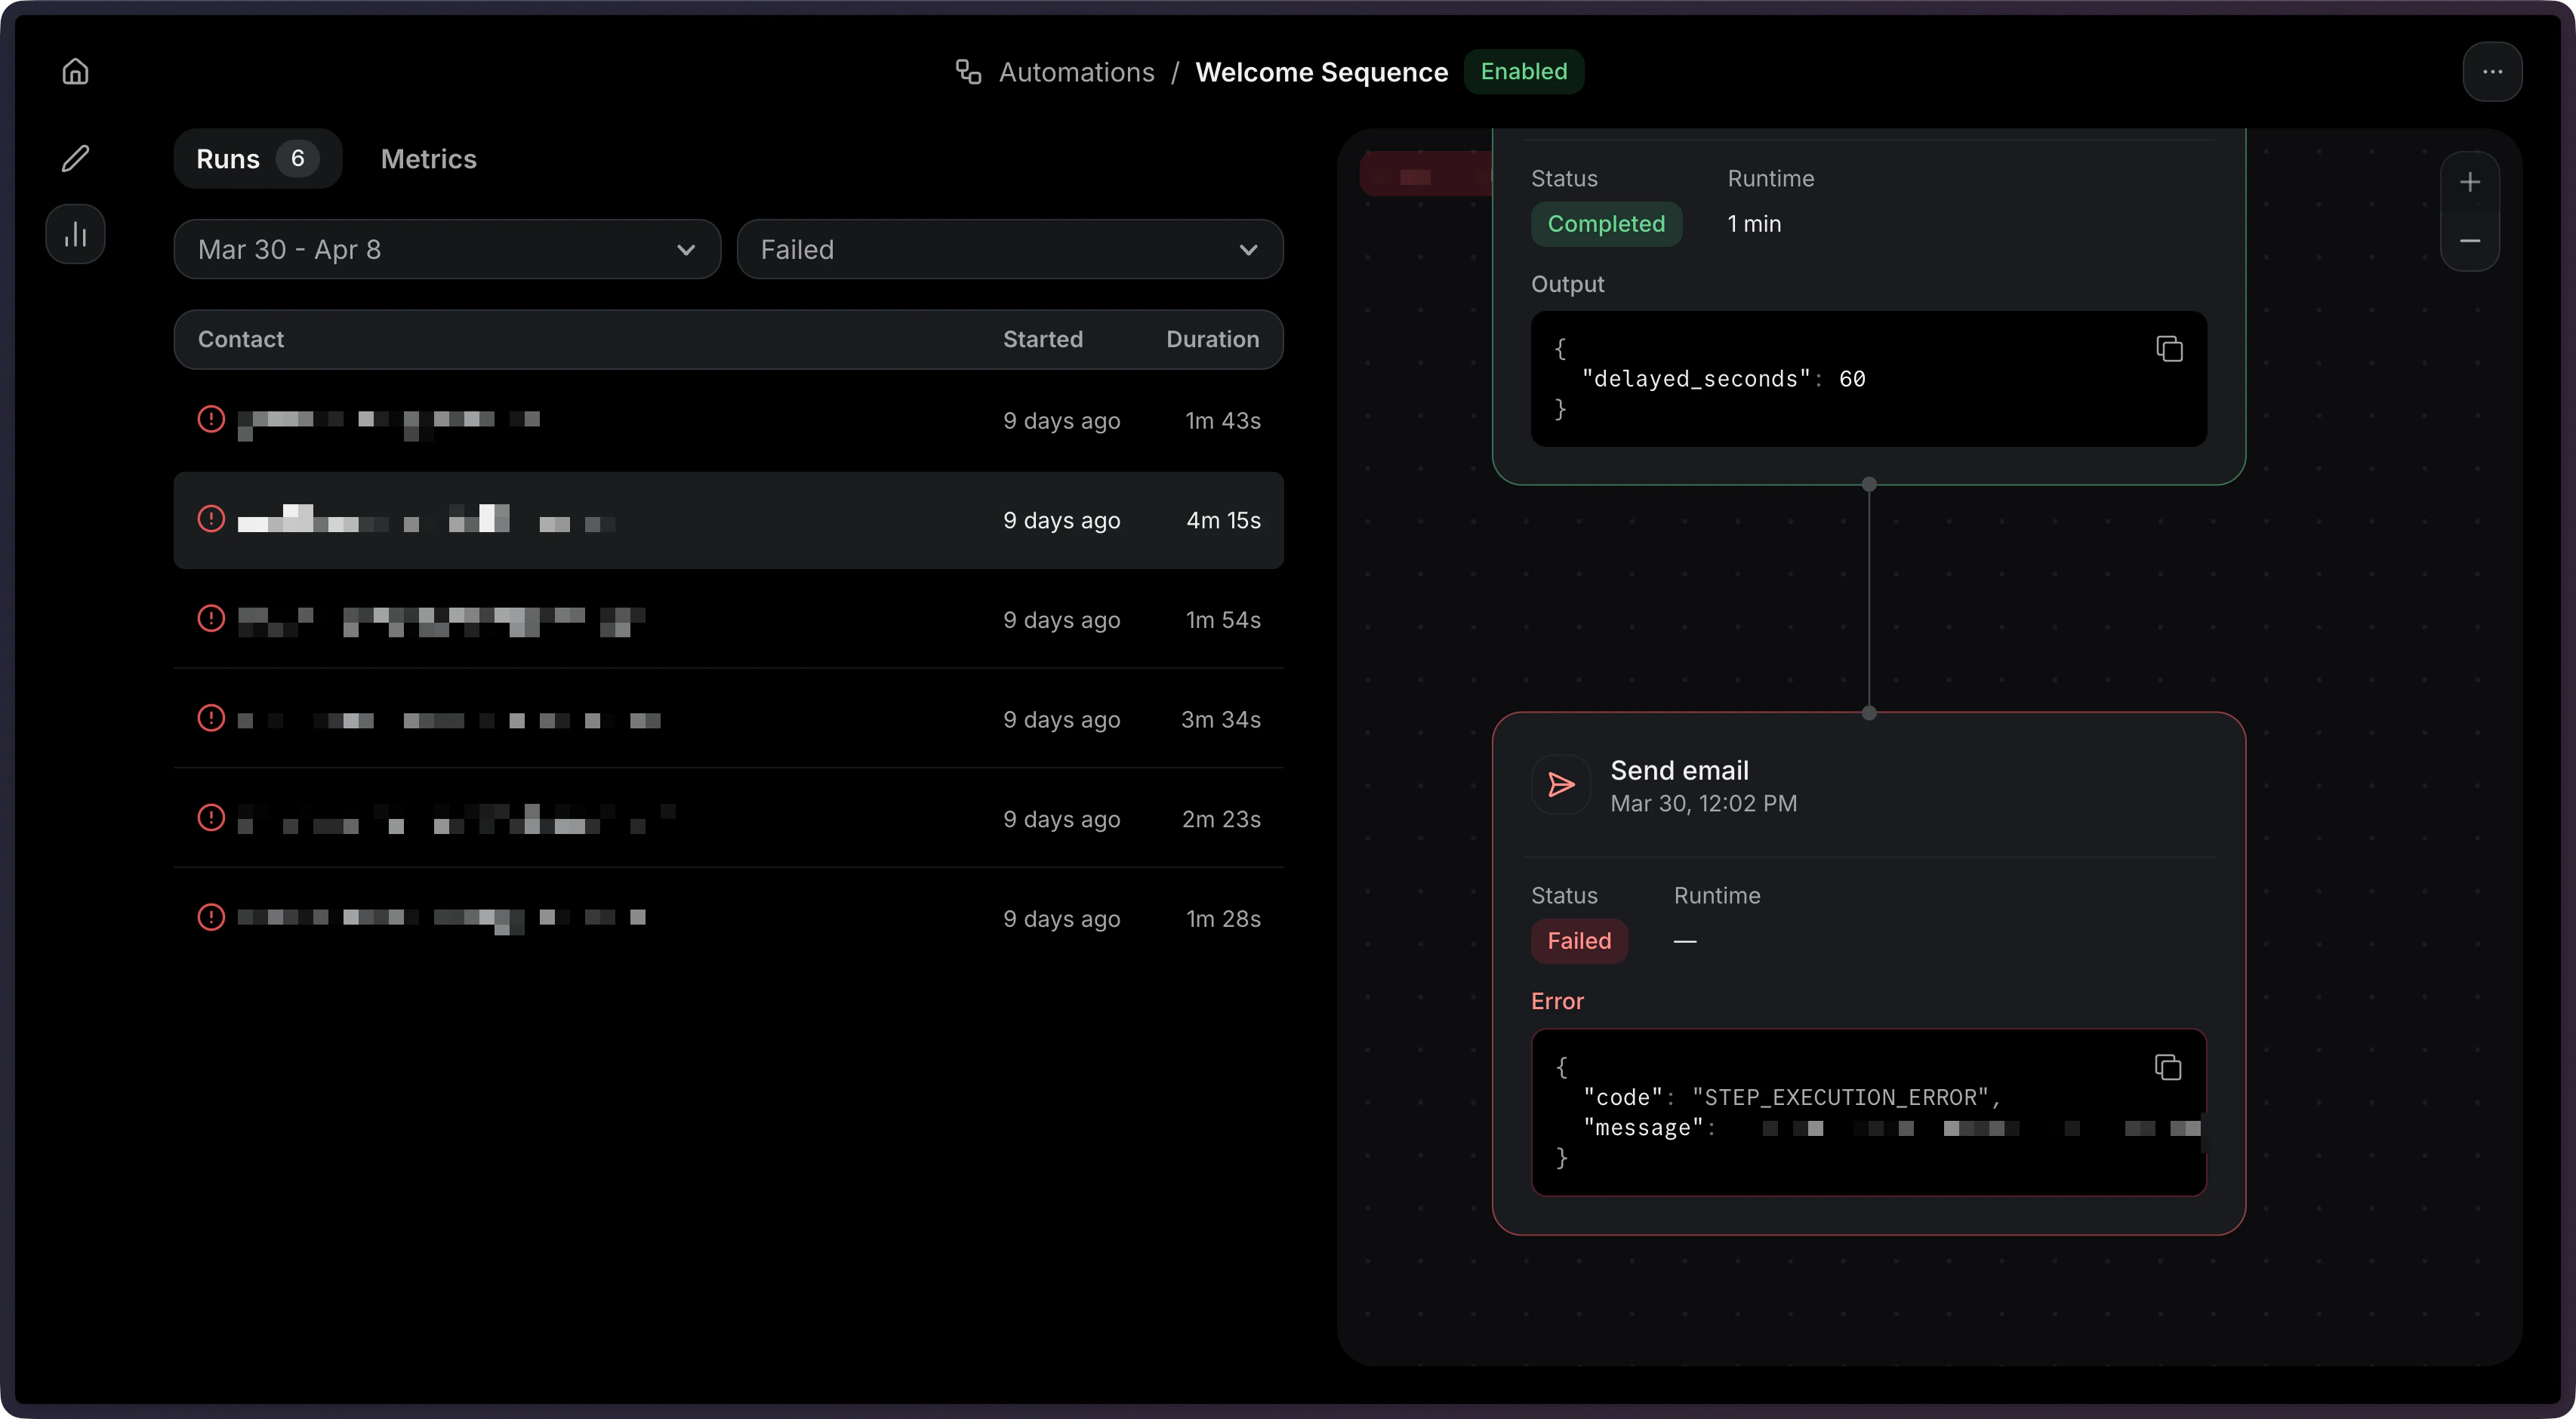
- List failed runs: Filter runs by
status=failedto find problematic executions. - Retrieve the run: Get the full run details including the
stepsarray. - Find the failed step: Look for the step with a
failedstatus. - Check the error: The
errorfield on the failed step contains details about what went wrong.
- Condition error: A referenced field may not exist in the event payload. See Condition for how conditions are evaluated.
- Wait for event timeout: The expected event was not received within the timeout window.
- Send email failed: The template may not be published, or the sender address may not be verified.
Stopping an Automation
- Using the dashboard
- Using the API
Click on the Stop button to stop an Automation.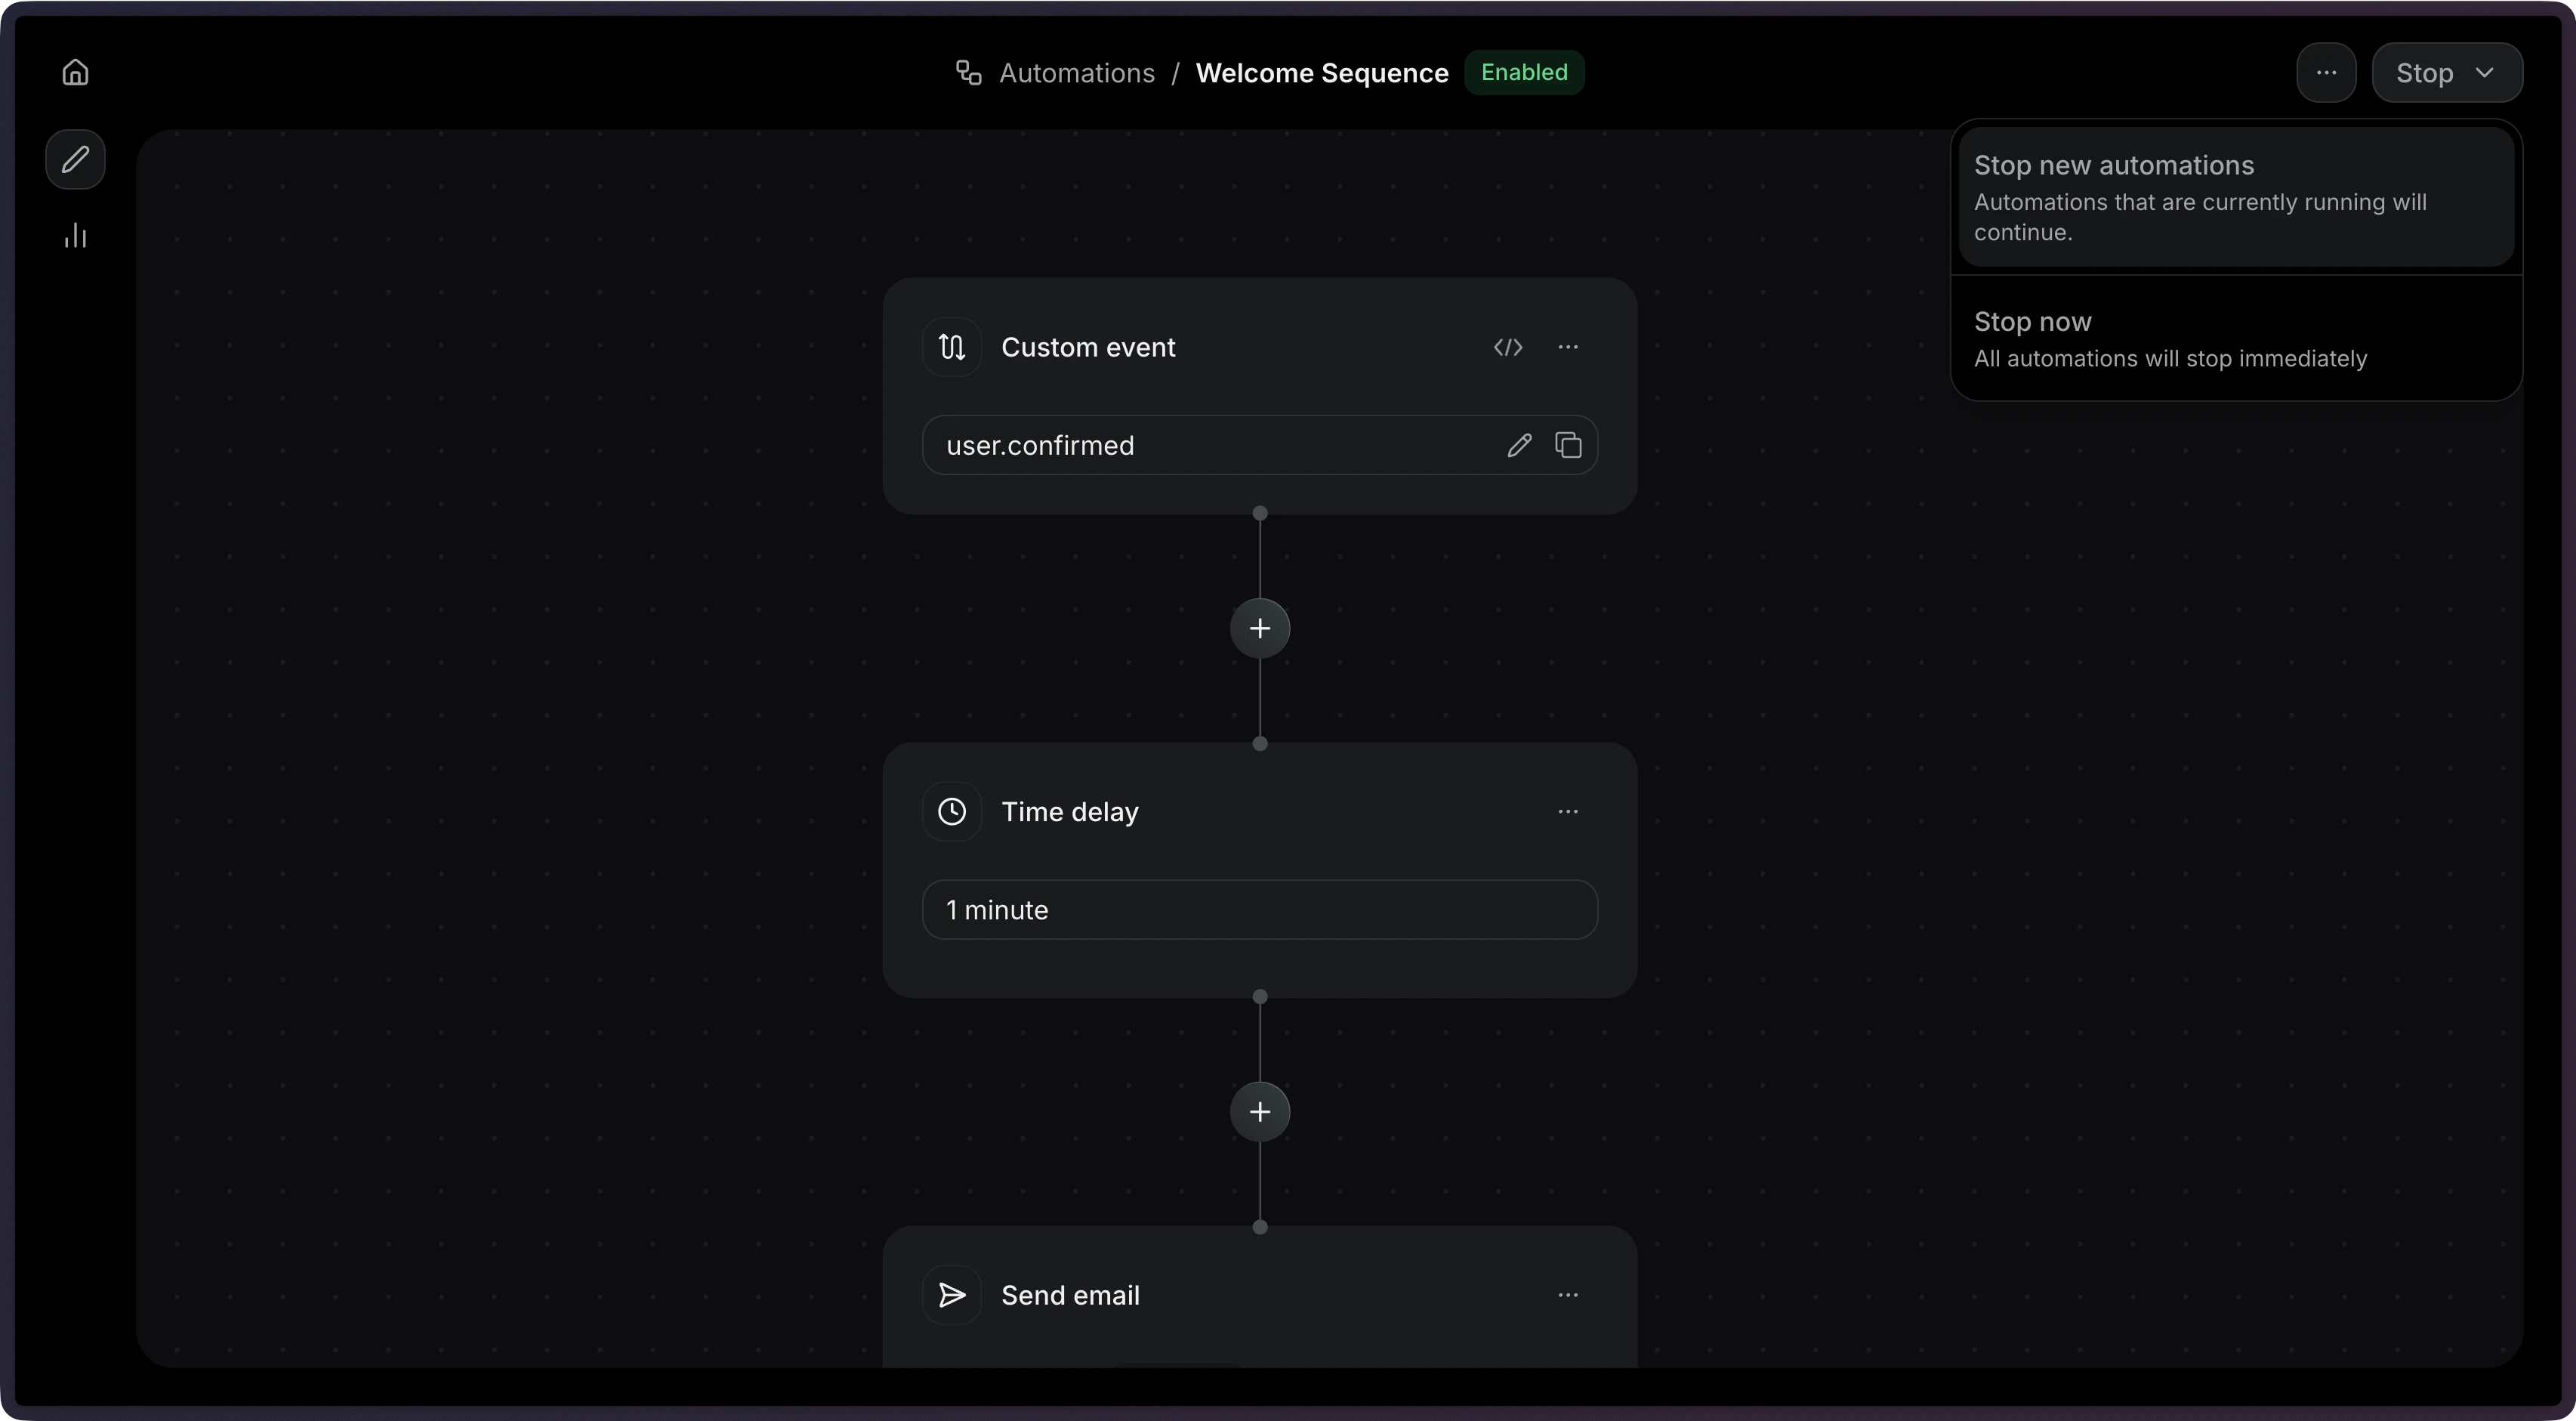
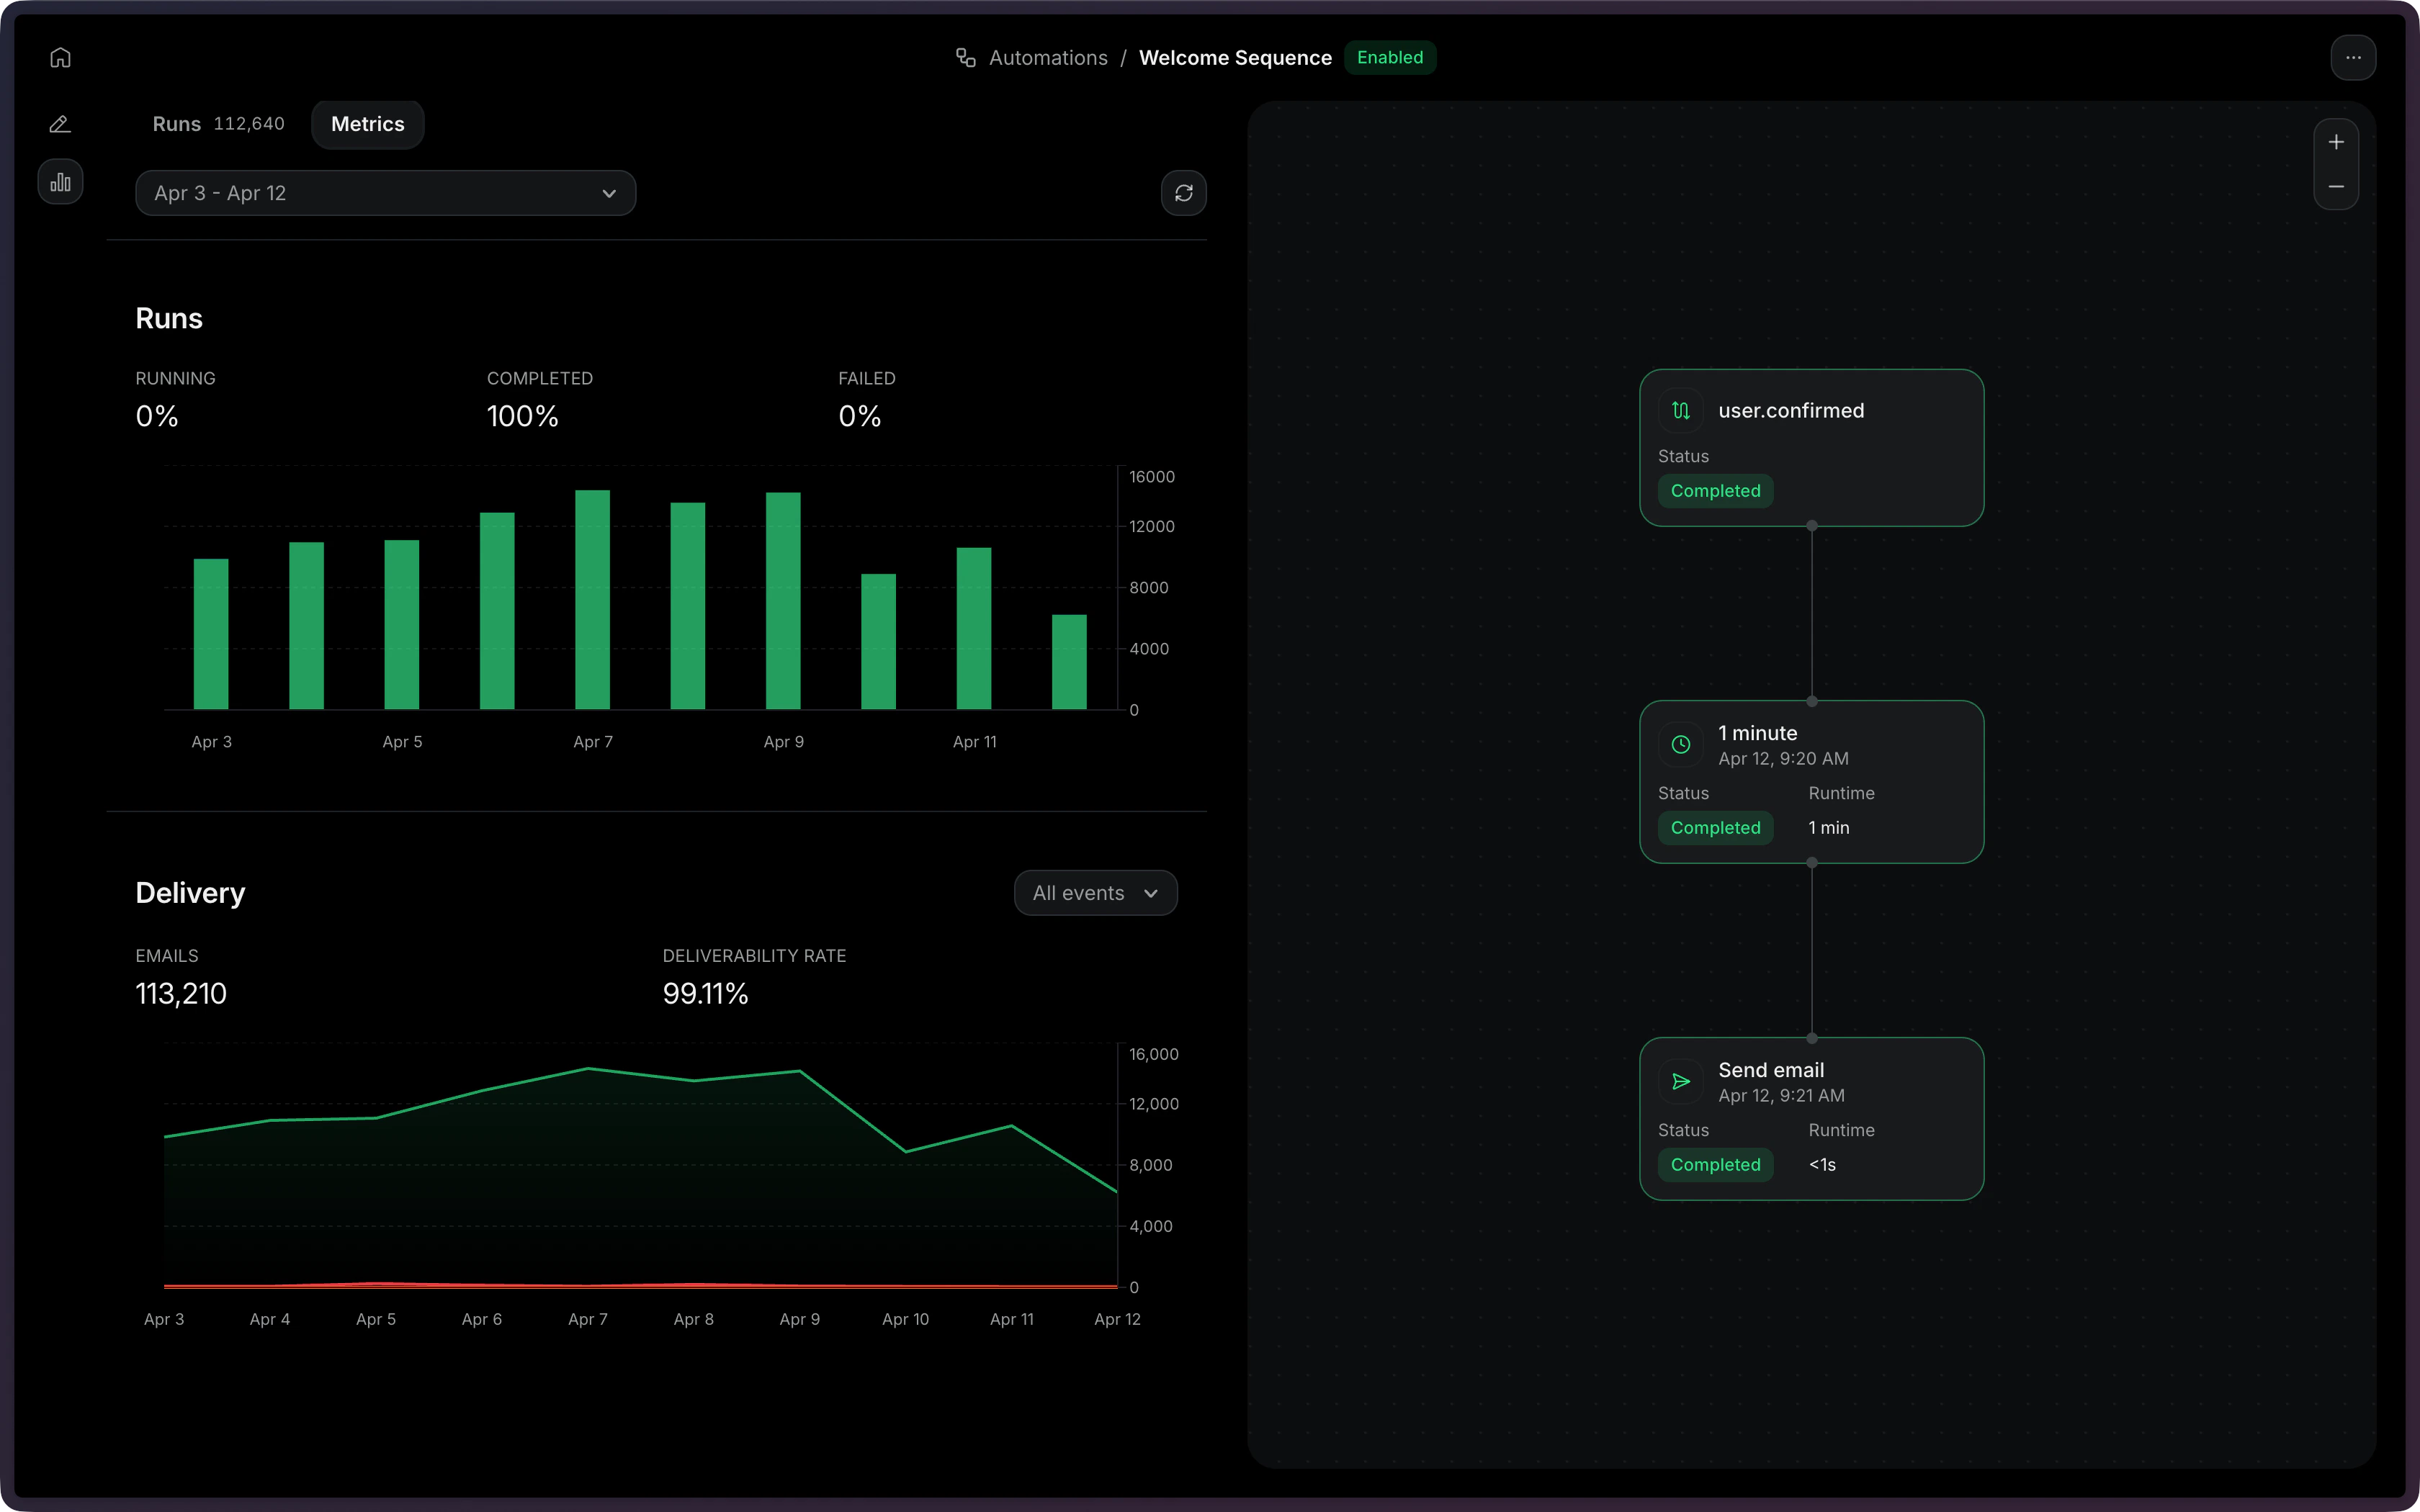
Viewing Metrics
In the dashboard, you can view overall metrics for any Automation. In the Observability panel for any Automation, select Metrics.